
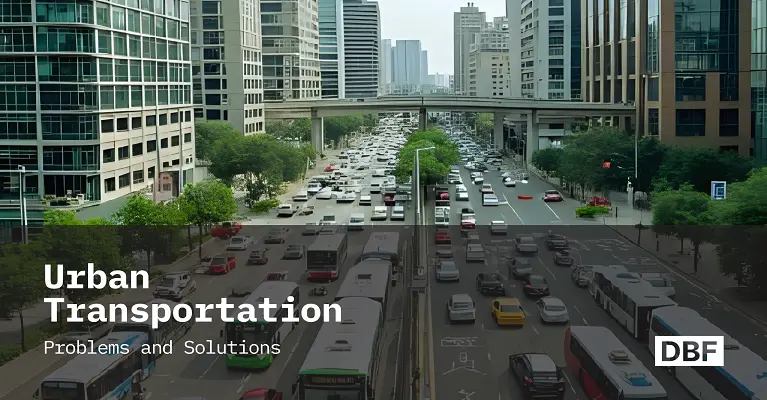
Urban Transportation Problems and Solutions
Urban mobility is under pressure from congestion, emissions, and poor connectivity. This blog explores key challenges and solutions such as multimodal transport, BRT, congestion pricing, and 15-minute cities. It highlights how DBF helps planners use real-time data, simulations, and zoning insights to design equitable, sustainable, and future-ready transport networks. · September 5, 2025
People are moving to cities faster than streets and rails can get them there. The United Nations states that the population of urban dwellers will increase from roughly 55% now to 68% in 2050. This implies that 2.2 billion more will be living in cities and requiring secure, low-carbon transport. But the infrastructure that is supposed to carry them is falling behind.
Why Urban Mobility is at a Crossroads
In 2024, the average U.S. driver spent 43 hours- an entire work week in some countries- stuck in traffic, costing the economy more than USD 74 billion in wasted time and fuel (INRIX).
Motorized transportation now makes up more than a third of all end-use CO₂, which puts net-zero goals at risk even though electric vehicle sales are rising, according to the IEA. The burden is not shared equally; low-income families spend almost 30% of their after-tax income just getting around. This keeps many people from getting jobs and getting to important services, according to itdp.org.
When you consider that less than half of the world's urban population has easy access to frequent public transport, the size of the problem becomes clear (itdp.org). Cities need quick, evidence-based answers.
New planning tools like Digital Blue Foam are starting to make this possible by letting construction agencies see areas of heavy traffic, pollution, and inequality on a single map.
Top Urban Transportation Problems
Traffic Congestion and Gridlock
Rush-hour congestion isn't limited to large cities anymore. In the midsize metros like Denver, delays grew by 19% last year.
When time is wasted, productivity is lost, the air quality deteriorates, and public health declines. Traffic congestion will continue to worsen faster than road-widening budgets unless we begin managing demand and adding more multimodal capacity.
Inadequate Public-Transit Connectivity
Getting to reliable buses or trains is still hit-or-miss. Less than half of city dwellers around the world live within 500 meters of a stop that has service at least every ten minutes.
This makes many people go back to driving their own cars or using ride-hailing services (itdp.org). This leads to a vicious cycle of fewer passengers and less money to run the business.
Car Dependency and Sprawl
The war-era zoning ordinance still promotes development in low-density suburbs with car-dominant travel.
As cities grow, the distance people travel to make a trip grows longer and running the public transport system becomes more costly, so the citizens become more dependent on cars.
High Transport-Sector Emissions
Transport's climate footprint is getting bigger, not smaller, at almost 8 gigatonnes of CO₂ per year. This cancels out the benefits of cleaner power grids and building codes, according to the IEA.
Road traffic also produces nitrogen oxides and tiny particles that kill 4.2 million people each year. Reducing car journeys to walking, cycling, and public transport that doesn't pollute the air is good for public health and the planet.
Poor Walking and Cycling Infrastructure
Over half of city trips are still in a car, despite 60% of them being under five kilometres. This is because sidewalks, crossings and bike lanes don't feel safe or complete (iRAP).
There are two costs: missed chances to save the environment and missed chances to make active mobility a part of everyday life.
Mobility-Equity Gaps
For the lowest-earning fifth of households in the United States, transportation costs eat up almost a third of their after-tax income. This makes it harder for people to move up in society and makes them choose between rent, food, and commuting (itdp.org).
Long, unreliable commutes are also linked to limited upward economic mobility, which shows how important it is to have affordable, quick options in every postcode.
Urban Freight and Last-Mile Pain
The "final kilometre" has become a congestion multiplier because of the high volume of e-commerce. According to Business Insider, last-mile deliveries now make up about 41% of total logistics costs and a larger share of curb-space conflicts.
Freight traffic will keep filling up streets that were built for people, not vans, unless there are massed depots, cargo bikes or off-peak delivery slots.
These seven pain points explain why urban mobility is at a tipping point and why every city desk responsible for coming up with the next generation of equitable, low-carbon transport networks needs data-rich, scenario-planning tools.
Actionable Solutions for Better Mobility in Urban Transportation
The fastest way to reduce the dominance of cars is to add more multimodal options. Shared bikes, e-scooters, and light-electric cargo vehicles already make more than 219 million trips a year in 67 cities around the world.
This shows that people will switch modes when there are a lot of vehicles and lanes that feel safe (public.ridereport.com). Cities that combine protected bike lanes with parking-protected scooter corrals see the biggest increases.
For example, Philadelphia's decision to paint 40 kilometres of new protected lanes cut bike-share trip times by eight percent and boosted ridership by double digits in just one season.
Digital Blue Foam helps planners figure out how to make these improvements before they paint the asphalt by putting proposed micro-mobility corridors on top of real traffic volumes and crash hot spots. This shows where there are gaps in a city's low-stress network.
Mass transit still has the most long-distance capacity, and Bogotá's TransMilenio is one of the best examples of this. Two million people ride on dedicated busways every day, which cost a small fraction of what heavy rail costs.
A recent fleet upgrade added 655 electric buses to cut down on local diesel pollution (Wikipedia, World Benchmarking Alliance). Comparable bus rapid-transit (BRT) corridors in Dar es Salaam and Johannesburg save more than 40% of travel time.
Transit-oriented development bridges land use to those transit spines. In contrast to single-use suburbs, compact, mixed-use zoning surrounding a station can reduce car travel by 50%.
But that is only possible if there is affordable housing and secure pedestrian connections. Planners can see how changing a height limit or floor-area ratio affects walk-to-transit coverage in minutes with DBF's zoning-overlay tool.
This helps elected officials find a balance between growth and equity goals.
After Stockholm started charging different amounts for congestion depending on the time of day, car trips into the city centre dropped by 20% and carbon emissions in the city dropped by 10% to 15% (Better Cities Project , toolsofchange.com).
Dynamic tolling works even better when used with AI-controlled traffic lights. Recent tests in the field show that adaptive systems can cut delays at intersections by as much as 25% (Wiley Online Library , omnisightusa.com).
Making districts that are 15 minutes long and easy to walk keeps a lot of trips off the network. After adding 1,000 kilometres of bike paths and making mixed-use zoning Routes a priority,
Paris has already raised the percentage of trips made by bike in the city to 11%, which is more than twice the percentage of trips made by car.
DBF's walk-time heat maps help planners figure out if schools, clinics and grocery stores are really within a short walk, and then they can change the layouts of the blocks until most of the daily needs fall within that nice five- to ten-minute range.
The next step is to electrify the last few kilometres of vehicles. The Times of India says that cities from Ahmedabad to Amsterdam are putting solar canopies and battery-powered chargers in bus depots and public parking lots. This turns parking lots into micro-grids that cut peak demand and operating costs.
Finally, real-time data and predictive routing turn plans that are set in stone into systems that are alive.
AI dashboards in Los Angeles and Pittsburgh now use camera feeds and probe-vehicle data to cut travel times by up to 25% by rerouting buses and goods in real time when there is traffic omnisightusa.com.
DBF combines similar data streams so that agencies can test "digital twins" of their networks by changing signal plans, curb allocations, and delivery windows long before changes happen on real streets.
AI and Data-driven Tools that Unlock Progress
A city's transport system now collects more data in a day than whole departments used to do in a year. By combining three features- real-time simulation, predictive site selection, and climate-mobility metrics- modern planning software turns that flood into foresight.
Real-time simulation engines send live data about probe-vehicle speeds, bus headways, and signal states to a digital twin of the street network.
When something happens that blocks a main road, the model virtually reroutes buses before traffic control centres send crews to the scene. This cuts response times and reduces secondary congestion.
Digital Blue Foam uses a similar feedback loop for planning: its browser twin takes in current traffic counts and pedestrian traces so designers can quickly see how adding a protected cycle track or a bus lane will change the flow of traffic across the grid.
The same setting can play back ten years' worth of climate predictions, showing which areas get too hot or too wet and how mode share changes when bad weather becomes the norm.
Machine-learning models trained on thousands of street and land-use characteristics are what make predictive siting work. Via's Remix and PTV Group's Visum score corridors based on how many people might use them for transit.
StreetLight Data's on-demand origin–destination matrices show freight choke points that manual counts can't see. Digital Blue Foam adds zoning envelopes and equity indices to those probability surfaces. This helps agencies find the best place to build a new BRT stop or mobility hub that will provide the most social benefit for the least amount of money.
Lastly, climate-mobility metrics close the loop by measuring the health and carbon effects of each situation. Dashboards turn the number of kilometres walked into the amount of emissions avoided, the number of diesel buses replaced into the amount of particulate matter reduced, and the number of congestion-pricing schemes into the amount of time saved by households.
AI platforms make it easier for decision-makers to choose and defend the mix of projects that will make cities' streets cleaner and more welcoming by showing those numbers next to cost and right-of-way drawings.
How Digital Blue Foam Accelerates Transport Planning in Urban Areas
DBF can take in traffic datasets that have already been processed. Live feeds may need a custom enterprise integration. The isochrone and network analysis layers help show how well the first and last miles are covered. Mode-share forecasts are made using external transport models.
Walkability and the quality of public spaces are both important. When you turn on the walk-time layer, the model shades streets in five-minute intervals. This makes it easy to see which parcels are too far from jobs, parks, or clinics to walk to.
If a proposed zoning change raises the maximum height or floor-area ratio, DBF redraws those catchments on the fly. This helps planners figure out if density really supports transit or is still stuck behind arterial barriers.
A congestion-simulation widget runs several signal plans against the speeds of real probe vehicles on the operations side. Designers can see how adaptive signals or dedicated bus lanes affect average intersection delay without having to open a spreadsheet by comparing them to a "do-nothing" baseline.
When the best balance of travel time, safety, and emissions has been found, one click exports the geometry and data tables into standard BIM formats so that traffic engineers and urban designers can work on them at the same time.
Members of the team can log in through the browser, mark up the same model, and undo changes if their assumptions change. This gets rid of the version-control problems that come up in desktop GIS workflows.
Digital Blue Foam shortens the time it takes to get from idea to agreement by combining real-time analytics with collaborative modelling. This gives city developers a practical way to plan streets and networks that move more people with fewer cars.
Conclusion
Urban mobility stands at the precipice of a knife: transport-related congestion and emissions are still increasing. But every city now has tested solutions- mass-transit corridors, walkable neighborhoods, congestion pricing, and live data- that can flip the script.
The case studies demonstrate the dividends: Bogotá's bus ridership is doubled, Paris's share of car travel is halved, and planners employing live digital twins are able to identify issues and gaps in equity well before they lay concrete.
Digital Blue Foam's browser-based sandbox brings all those lessons together in one environment, so teams can experiment with various layouts, changes in density, and climate measurements in minutes rather than months.
The faster cities can move from static drawings to data-rich simulations, the faster streets can swap gridlock for cleaner air, shorter trips, and public spaces where people, not cars, dictate the speed.
Frequently Asked Questions
1. What are the most typical problems of transport in cities?
Wherever you go, you experience the same problems: constant traffic jams, public transport that is untrustworthy or under-resourced, roads that are not safe to walk or cycle, and freight trucks hogging too much curb space. Add growing transport emissions and huge access disparities between rich and poor neighbourhoods, and you have a transport system that doesn't work well or deliver.
2. How can cities really cut down on traffic?
Global experience illustrates that no solution fits all. Traffic congestion pricing and dynamic traffic signal control reduce traffic during peak hours. High-capacity bus or rail corridors move thousands of cars at once. Giving people protected bike lanes and wider sidewalks as alternatives makes them more appealing. When these steps are planned together and data is used to show where each one has the biggest impact, traffic volumes go down even as populations grow.
3. What are some real-life examples of solutions that last?
Stockholm's dynamic road charges cut city centre traffic by 20%, Bogotá's e-BRT buses carry two million a day, and Paris's 15-minute-city investments doubled cycling volumes and cut the number of cars in the city centre to single figures. Every success is a thought-out package with adjustments to infrastructure, prices, and land use.
4. How does Digital Blue Foam help planners reach modern transportation planning goals?
DBF gives you a live digital twin that shows you how many cars are on the road, how long it takes to get from one place to another, and how far you can walk in a certain amount of time. Planners can drop a proposed BRT line, change the coverage of a cycle track or test a congestion charge zone and see right away how it will affect travel time, emissions and access equity. The same model can be sent to BIM and GIS, which makes it easier for people to work together from idea to permit.
References
- https://www.un.org/uk/desa/68-world-population-projected-live-urban-areas-2050-says-un
- https://inrix.com/press-releases/2024-global-traffic-scorecard-us/
- https://www.iea.org/energy-system/transport
- https://itdp.org/2024/01/24/high-cost-transportation-united-states/
- https://irap.org/2022/11/cycling-and-walking-for-people-and-planet-new-reports-draw-link/
- https://www.businessinsider.com/ai-transforms-last-mile-delivery-predictive-analytics-route-optimization-2025-7
- https://public.ridereport.com/
- https://en.wikipedia.org/wiki/TransMilenio
- https://www.worldbenchmarkingalliance.org/publication/urban/companies/transmilenio-2/
- https://better-cities.org/energy-environment/congestion-pricing-often-wins-over-critics/
- https://toolsofchange.com/en/case-studies/detail/670
- https://onlinelibrary.wiley.com/doi/10.1155/2024/3035753
- https://omnisightusa.com/blog/smart-city-traffic-management-complete-guide
